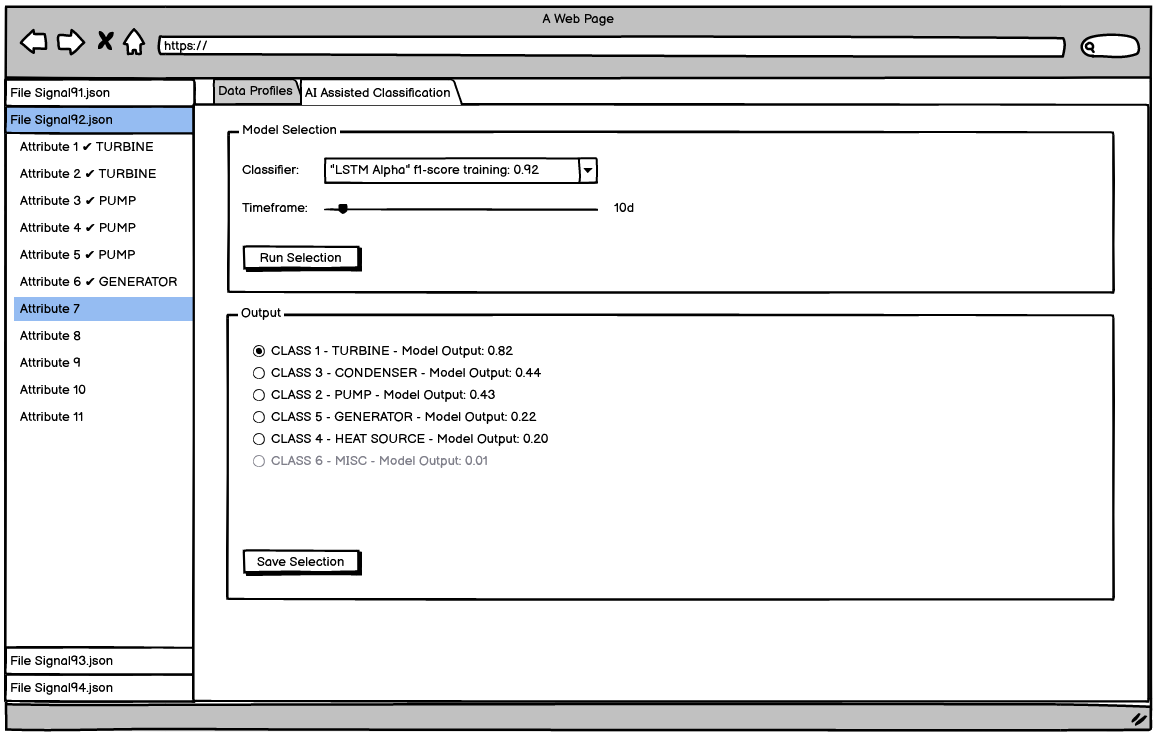
A Django web application for complex visualization of large-scale power plant data from Siemens, built in cooperation with the FAU Department for Data Management. The app combines time-series plots, outlier analysis, and topological data analysis (persistent homology via giotto-tda) with a CNN-based time-series classifier. Its purpose: re-match sensor data to the correct sensors where labels were lost, and detect anomalies.
The two analysis views render interactive box plots, 3D projections, persistence diagrams, and raw time plots in the browser; the CNN classifies time series from their Gramian Angular Field encodings. A helper module converts between the involved data formats (SQL dumps, ZIP archives, CSV, NumPy arrays).
Technologies: Django, Python, Pandas, TensorFlow, giotto-tda, JavaScript